Last week JOYN ticked over the 600 clients-mark, a milestone we’re mighty proud of. The more eagle-eyed among you might have noticed how we celebrated: by releasing an improved Data & Analytics section on your client-side JOYN dashboards!
The importance of data and analytics in making smarter business decisions is well-documented, but the uptake in the world of recruitment and hiring has been a little slower to get on board, with companies only recently starting to understand the importance of monitoring time to hire and quality of hire, as opposed to simpler metrics like numbers of applicants.
In the interest of constantly improving staff recruitment, JOYN’s model is to combine the human expertise of our HR and Recruitment Consultants with tech smarts, thus delivering greater outcomes and efficiencies for clients. That’s why we’ve moved the JOYN dashboard forward.
Read on to see the tech smarts come to life on your JOYN dashboard, and how they help make your own data-driven decisions around staff recruitment and smarter hiring. Open your client-side dashboard and follow along for the full tour:
Data & Analytics Dashboard

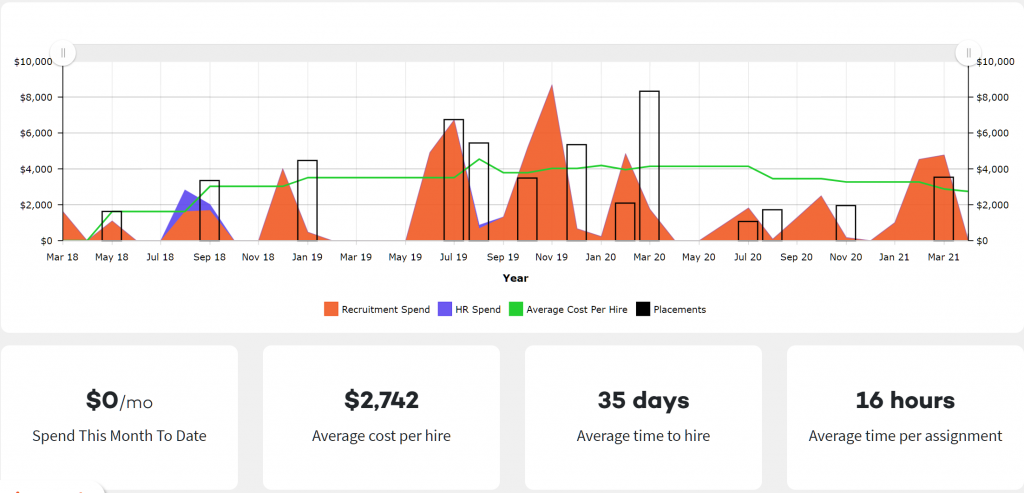
Let’s start with the basics. Give the Data & Analytics button over on your left-hand side navigation bar a click and you’ll be presented with your company’s key hiring data metrics with JOYN.
The example above shows a client with three years’ history with JOYN, so your appearance may be different if more recently on board. You can change the period viewed by grabbing and sliding the buttons on top of the chart.
- Orange peaks show monthly recruitment spend with JOYN
- Purple chart shows (stacked) monthly HR spend with JOYN
- Each black column signifies a month where a successful hire was made with JOYN. Hover over the column to see the roles filled and the cost, with the height of the column correlating to the cost
- The green trend line running through shows your company’s average Cost Per Hire with JOYN for all recruitment assignments worked on
Below the main chart you have your key metrics with JOYN. The first metric shows your total spend with JOYN in the current month, for both Recruitment and HR assignments. You can click into the other metrics beside this for an even more granular view of your month. Let’s roll through some of these metrics.
Metric One: Average Cost Per Hire

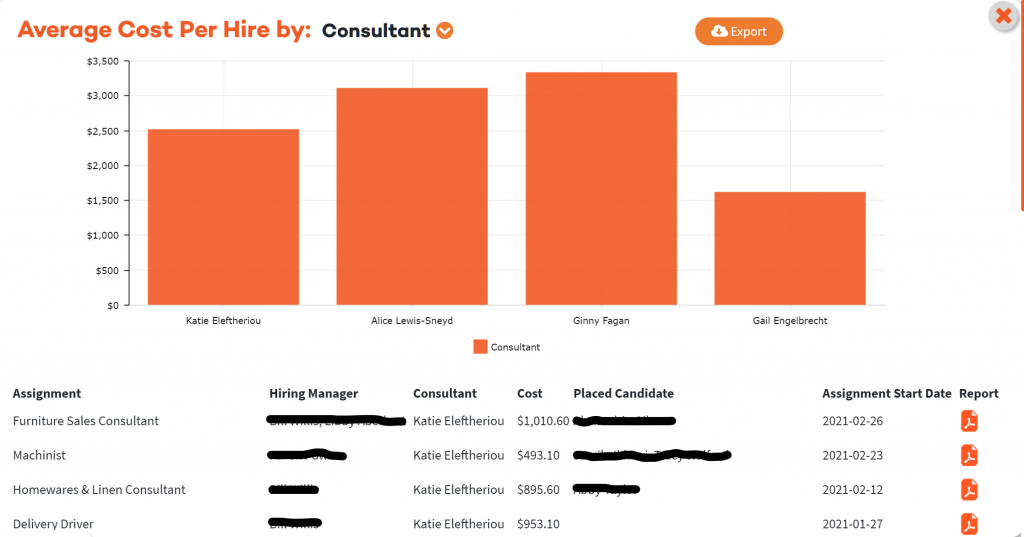
One of the most important metrics in managing your company hiring metrics is the Cost Per Hire. With JOYN we are able to calculate the cost of the Recruitment Consultant’s time plus any extras such as advertising, testing or background checks, and divide this by the number of hires made through JOYN to work out your average.
Our mantra at JOYN is “Better Hires at Half the Cost” so this number should compare favourably against utilising more traditional recruitment approaches such as engaging a recruitment agency!
In the report above you will see you can view the cost-per-hire on a per-Consultant basis and also on a per-Hiring Manager basis too. You can also see each recruitment assignment broken down to show the job title, Hiring Manager, Consultant, Cost, Placed Candidate, when the Assignment started and the Closed Assignment Report (showing even more data around candidate numbers, Consultant’s report notes, and your Rating given).
Don’t worry, you’re not restricted to the dashboard. You can also export the report into PDF or CSV formats to use in other systems or as handouts for meetings.
Metric Two: Average Time To Hire

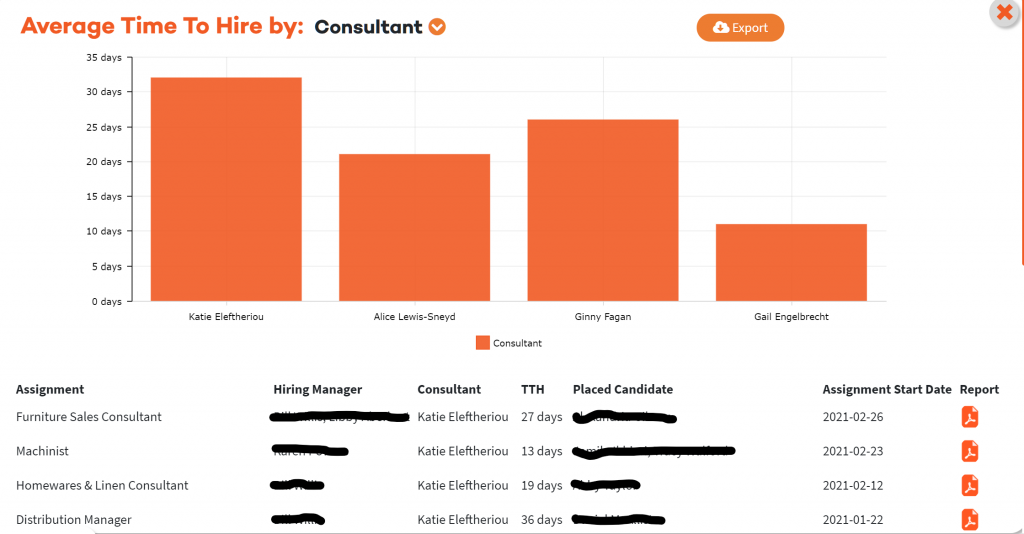
The second metric you’ll see on your dashboard is the average time to hire, which is vital when looking through key hiring data. Whilst things slowed down slightly in 2020 as COVID-19 impacted hiring intentions, it is as competitive as ever again to secure top talent. In some cases it’s even more difficult, thanks to the closed borders, as they restrict overseas staff recruitment.
Time is often of the essence and having a determined approach, a clearly thought out hiring plan, and a sense of urgency alongside your recruiter is as important as any employment branding or benefits and perks of the job.
In your JOYN report above, you will be able to see the time to hire for every recruitment assignment individually, as well as the averages for either your Consultants or your Hiring Managers. This data is calculated from the first timesheet entry of your JOYN Consultant to the last when the assignment is closed off, so if your process involves taking over the process from, say, shortlisting stage, then factor that extra time in on top too.
According to LinkedIn in 2017 only 30% of companies surveyed globally were able to achieve a Time to Hire average of less than one month. How do your JOYN statistics compare?
Metric Three: Time per Assignment
Finally, you will see that we are now able to track the average time taken per Assignment. This differs from average time to hire, as it looks only at the hourly (or part-hourly) time blocks billed by your JOYN Consultant on an Assignment, as opposed to the number of days that that work was carried out across.
Once again you can click into the report for extra detail, view data per Consultant or per Hiring Manager, and export the data should you need to use it elsewhere.
For many businesses, the deluge of data and information can be a huge source of confusion and uncertainty. We have developed these reports to be as intuitive and user-friendly as possible, whilst delivering transparency and key metrics to enable better decisions around your company’s hiring processes. When you next visit your Data & Analytics dashboard, there will be a short on-screen tutorial to show you around, but if you want to skip this and have some more human help, we are more than happy to chat!
Here To Help
Reach out to the team at JOYN for everything from HR Health Checks to questions about your recruitment process. We’re always here to help! Contact us here and we look forward to hearing your feedback when you’re ready.
